As you might recall, a few months ago I sent out a call (“Collecting Sharing Information for Known Relationships“) for information about the amount of DNA shared by people having a known genealogical relationship. I was hoping to get a better picture of the ranges of the amount of DNA shared by people in these relationships (through about the third cousin range). The incredibly generous genetic genealogy community responded by submitting data bout more than 6,000 relationships!
I posted information a few weeks ago (“Collecting Sharing Information for Known Relationships – Part II“), but today I have an update.
This data is shared under a Attribution-NonCommercial-ShareAlike CC license. You are free to share and use the information for non-commercial purposes, as long as you give proper attribution and release anything you create under the same license.
NOTE: The information below is available HERE in an Excel file.
There are several important limitations to keep in mind. For example, this is all self-reported data, which means that there could be errors in relationships as well as in data entry. Additionally, people sometimes reported the same relationship from multiple companies. As a result, be sure to consider these limitations when utilizing this data.
I would love to hear your thoughts about this data, including the results as well as other ways to analyze the data set.
.
No sibling comparisons?
I didn’t focus on those (siblings and parent/child) because there wasn’t much variation, but I’ll be sure to process those submissions soon.
Still lots to do, including the analysis of longest segment and distribution data.
Thank you, Blaine.
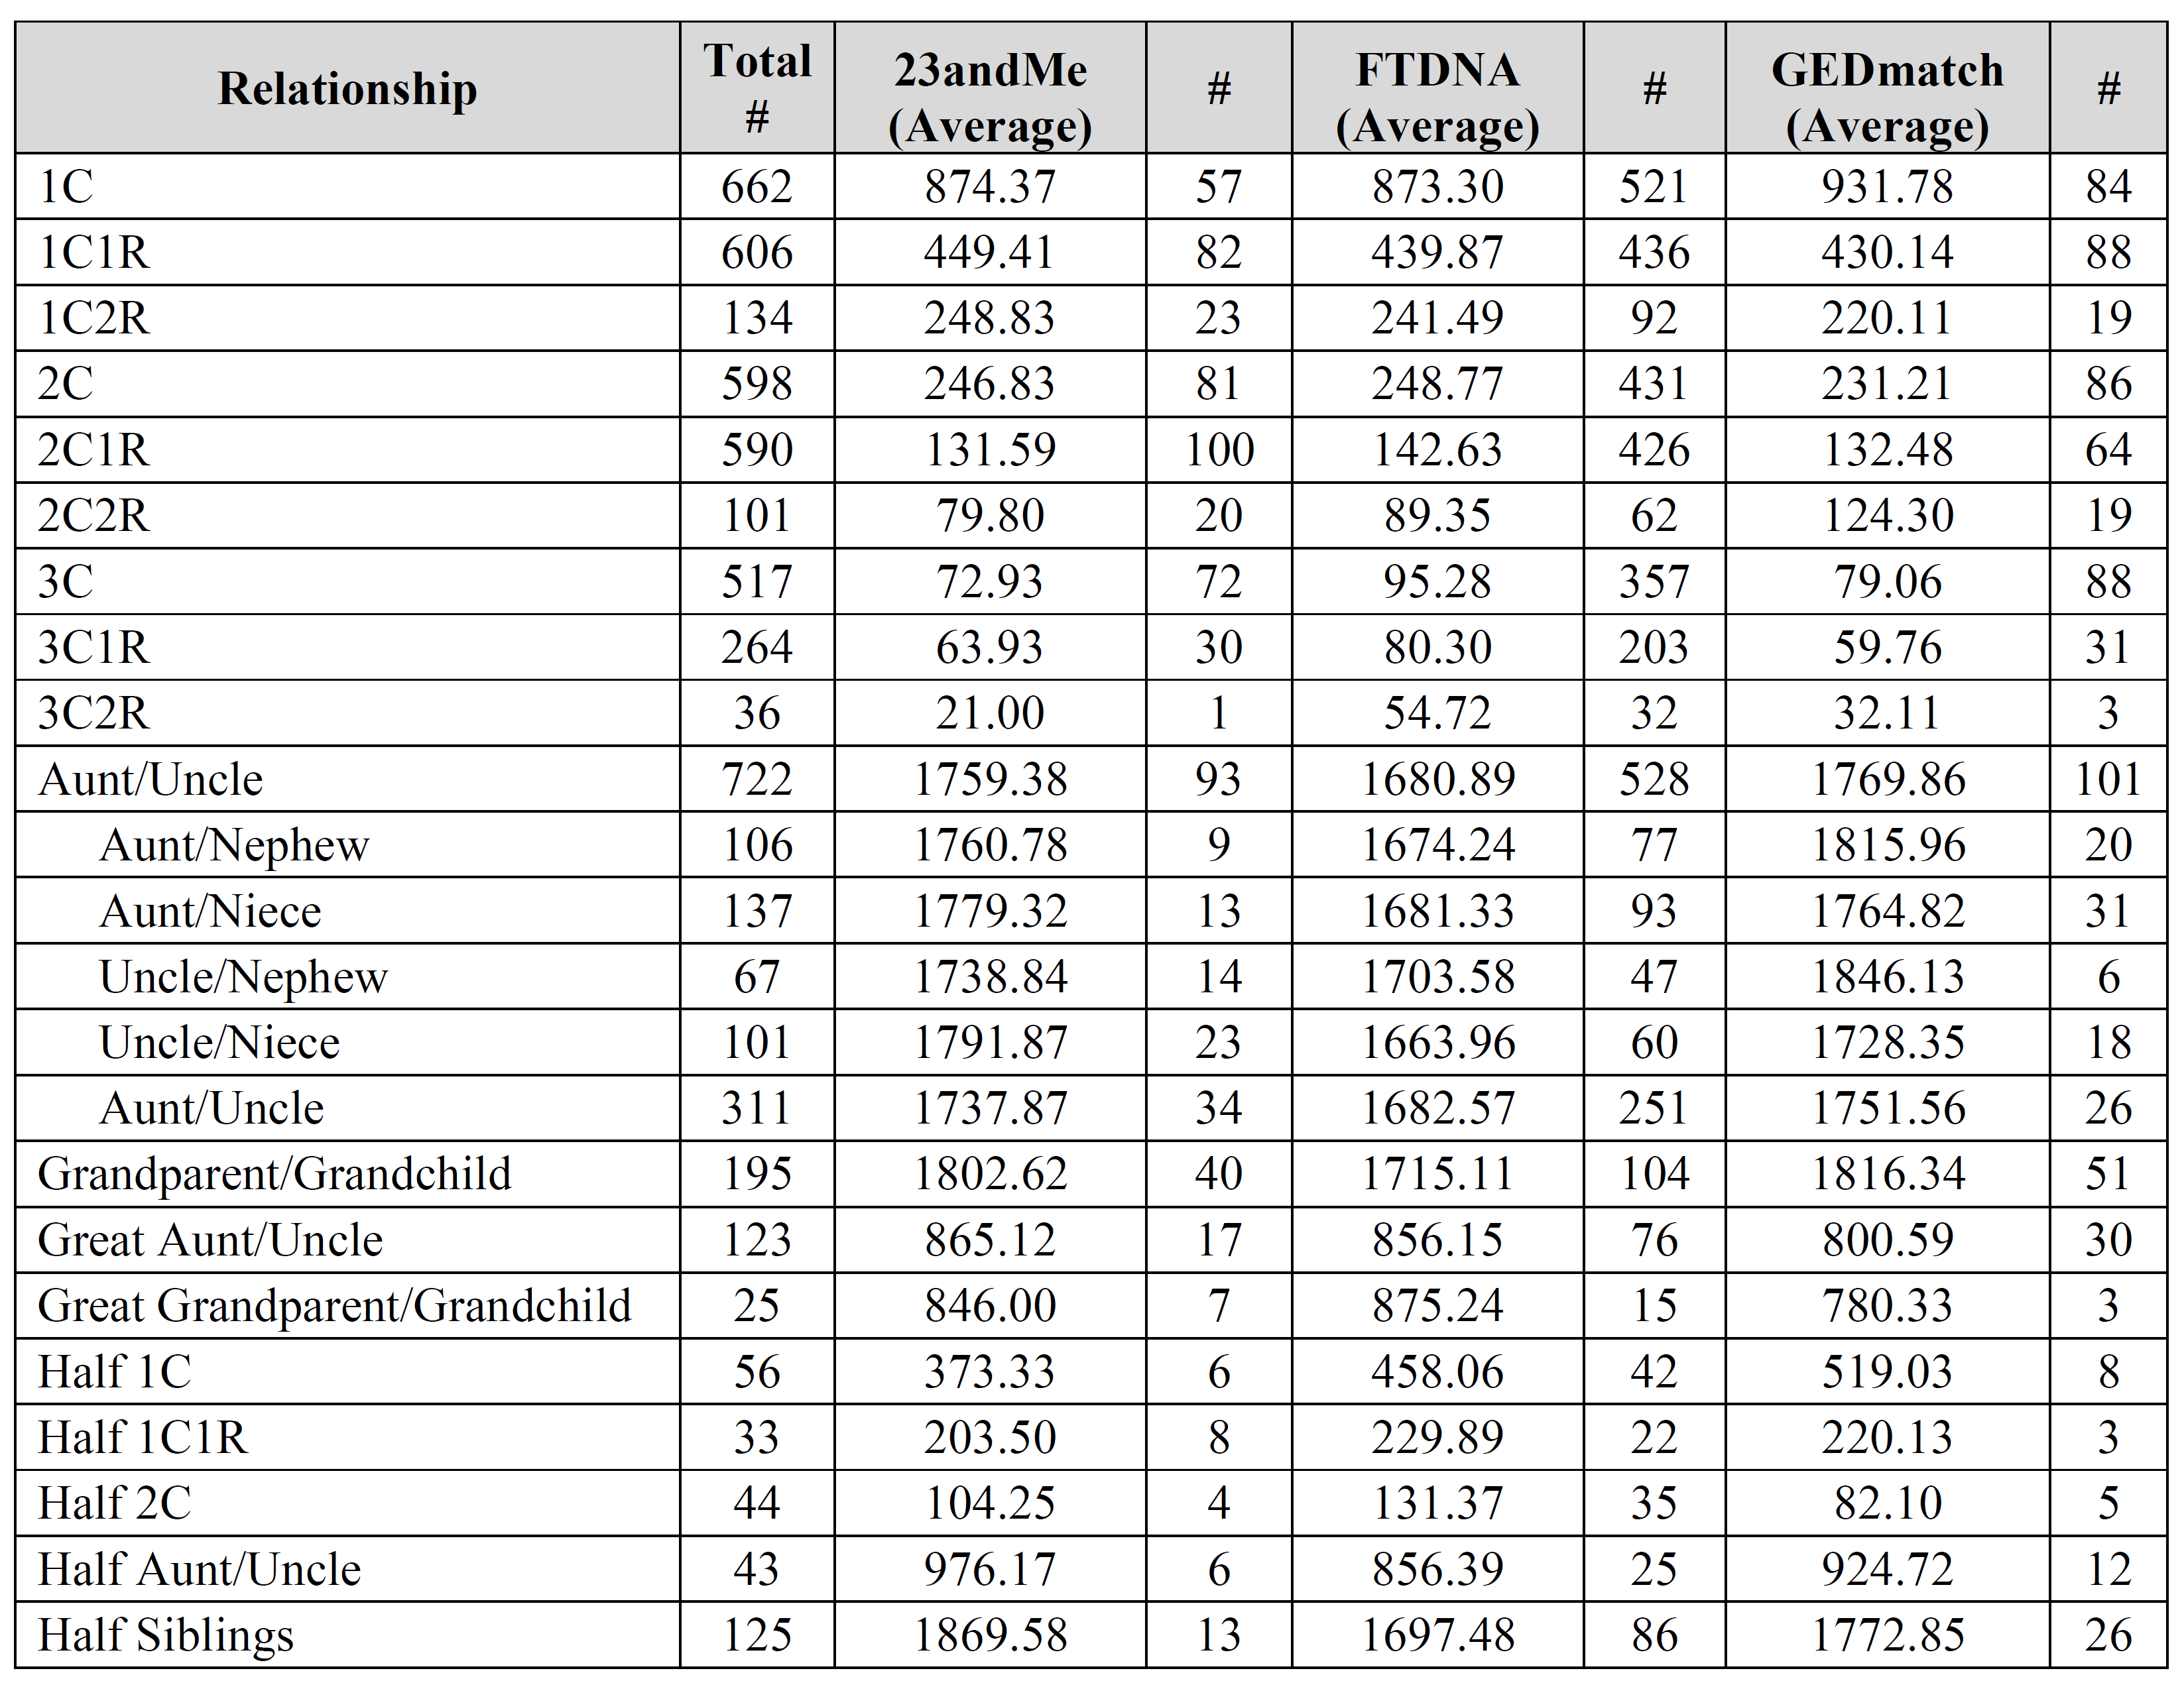
Could you please clarify what is meant by both of the “Aunt/Uncle” relationships used on 2 different lines with 2 different sets of numbers, please? I can probably guess the first, but am having trouble understanding the second instance.
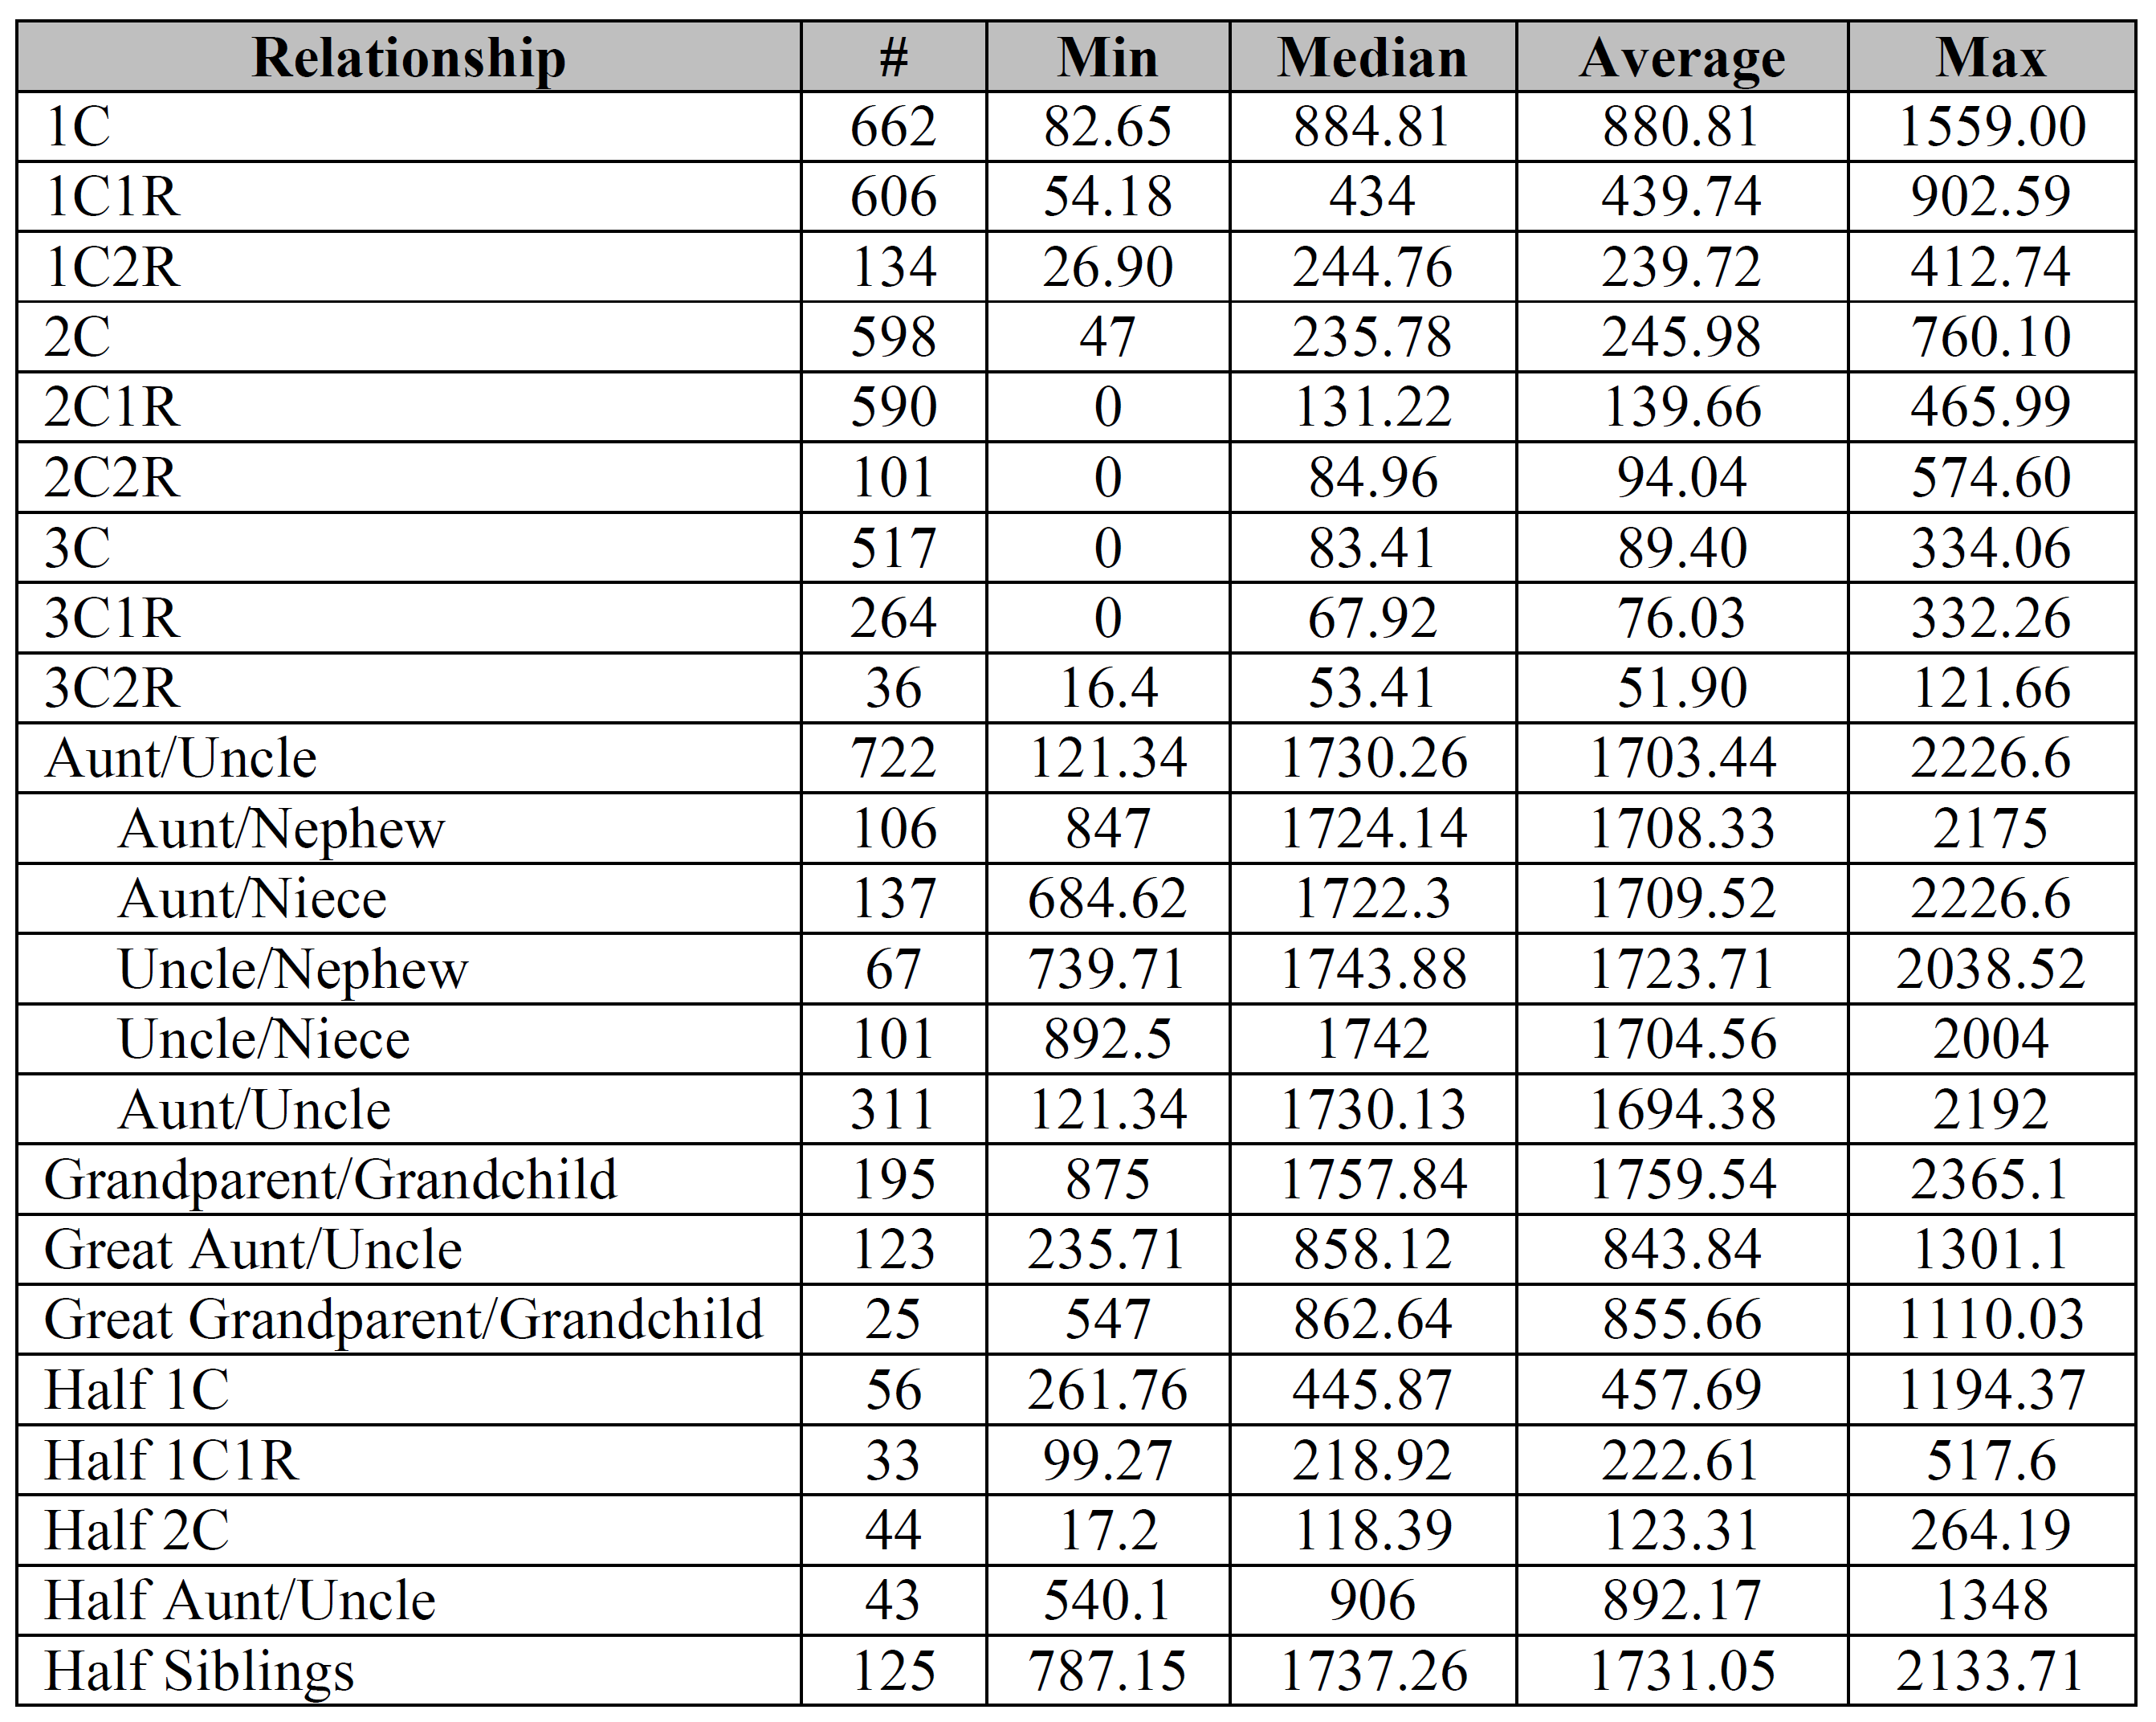
The first Aunt/Uncle with 722 instances is all the possible combinations.
However, not everyone provided the sex of both individuals, so in 311 instances it was just labeled Aunt/Uncle/Niece/Nephew in some non-specific way. In other words, the main Aunt/Uncle category includes all four possible combinations plus those that weren’t specified. Adding all five types should come to 722.
This took a huge amount of your time and I thank you so much. I had already suspected that nearly all the “matches” for FTDNA Family Finder would have a low return (not mentioning the other person never responding). Now I know which ones to contact. And it looks like “Crowd Sourcing” is still the excellent (and inexpensive) way to find matches. Thank you again!!!
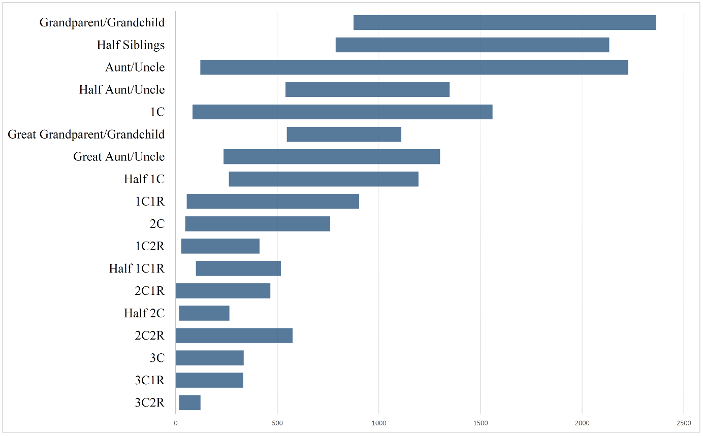
Especially after looking at the bar charts, I find it interesting how similar many of the Min/Max values are for the relationships from 1C2R down to 3C1R. Of course, the Median/Average values tell a different story.
What is special about the aunt/uncle that you broke it down by gender combinations – but did not do that with any other relationship? I would not imagine that it matters much in any case and it certainly doesn’t seem to here.
Israel – aunt/uncle was the only relationship (other than perhaps siblings) that people often provided gender combinations for (probably due to the fact that gender is inherent in the words aunt/uncle/niece/nephew), so I thought I’d throw that extra information into the mix. You’re absolutely right, it doesn’t seem to make much of difference for either the median or the average.
Since FTDNA considers ~6766 cM as complete, but 23andme considers ~7439 cM for females and ~7257 cM for males as complete, might it be possible to try to adjust the reported cMs to one or the other or both? (Reported GEDMatch results might be up in the air.)
Maybe you could make this data collection a periodic event, attracting more volunteers as more people learn about it, and perhaps adding to/refining the requested data as time goes on.
David – I don’t think standardization is possible with the current information we have from the two companies.
The portal is still open and collecting submissions; I’ve received a number of new submissions as a result of this data release!
Any chance you could say what % are from each source, in order to facilitate my own guess-timates? Thank you.
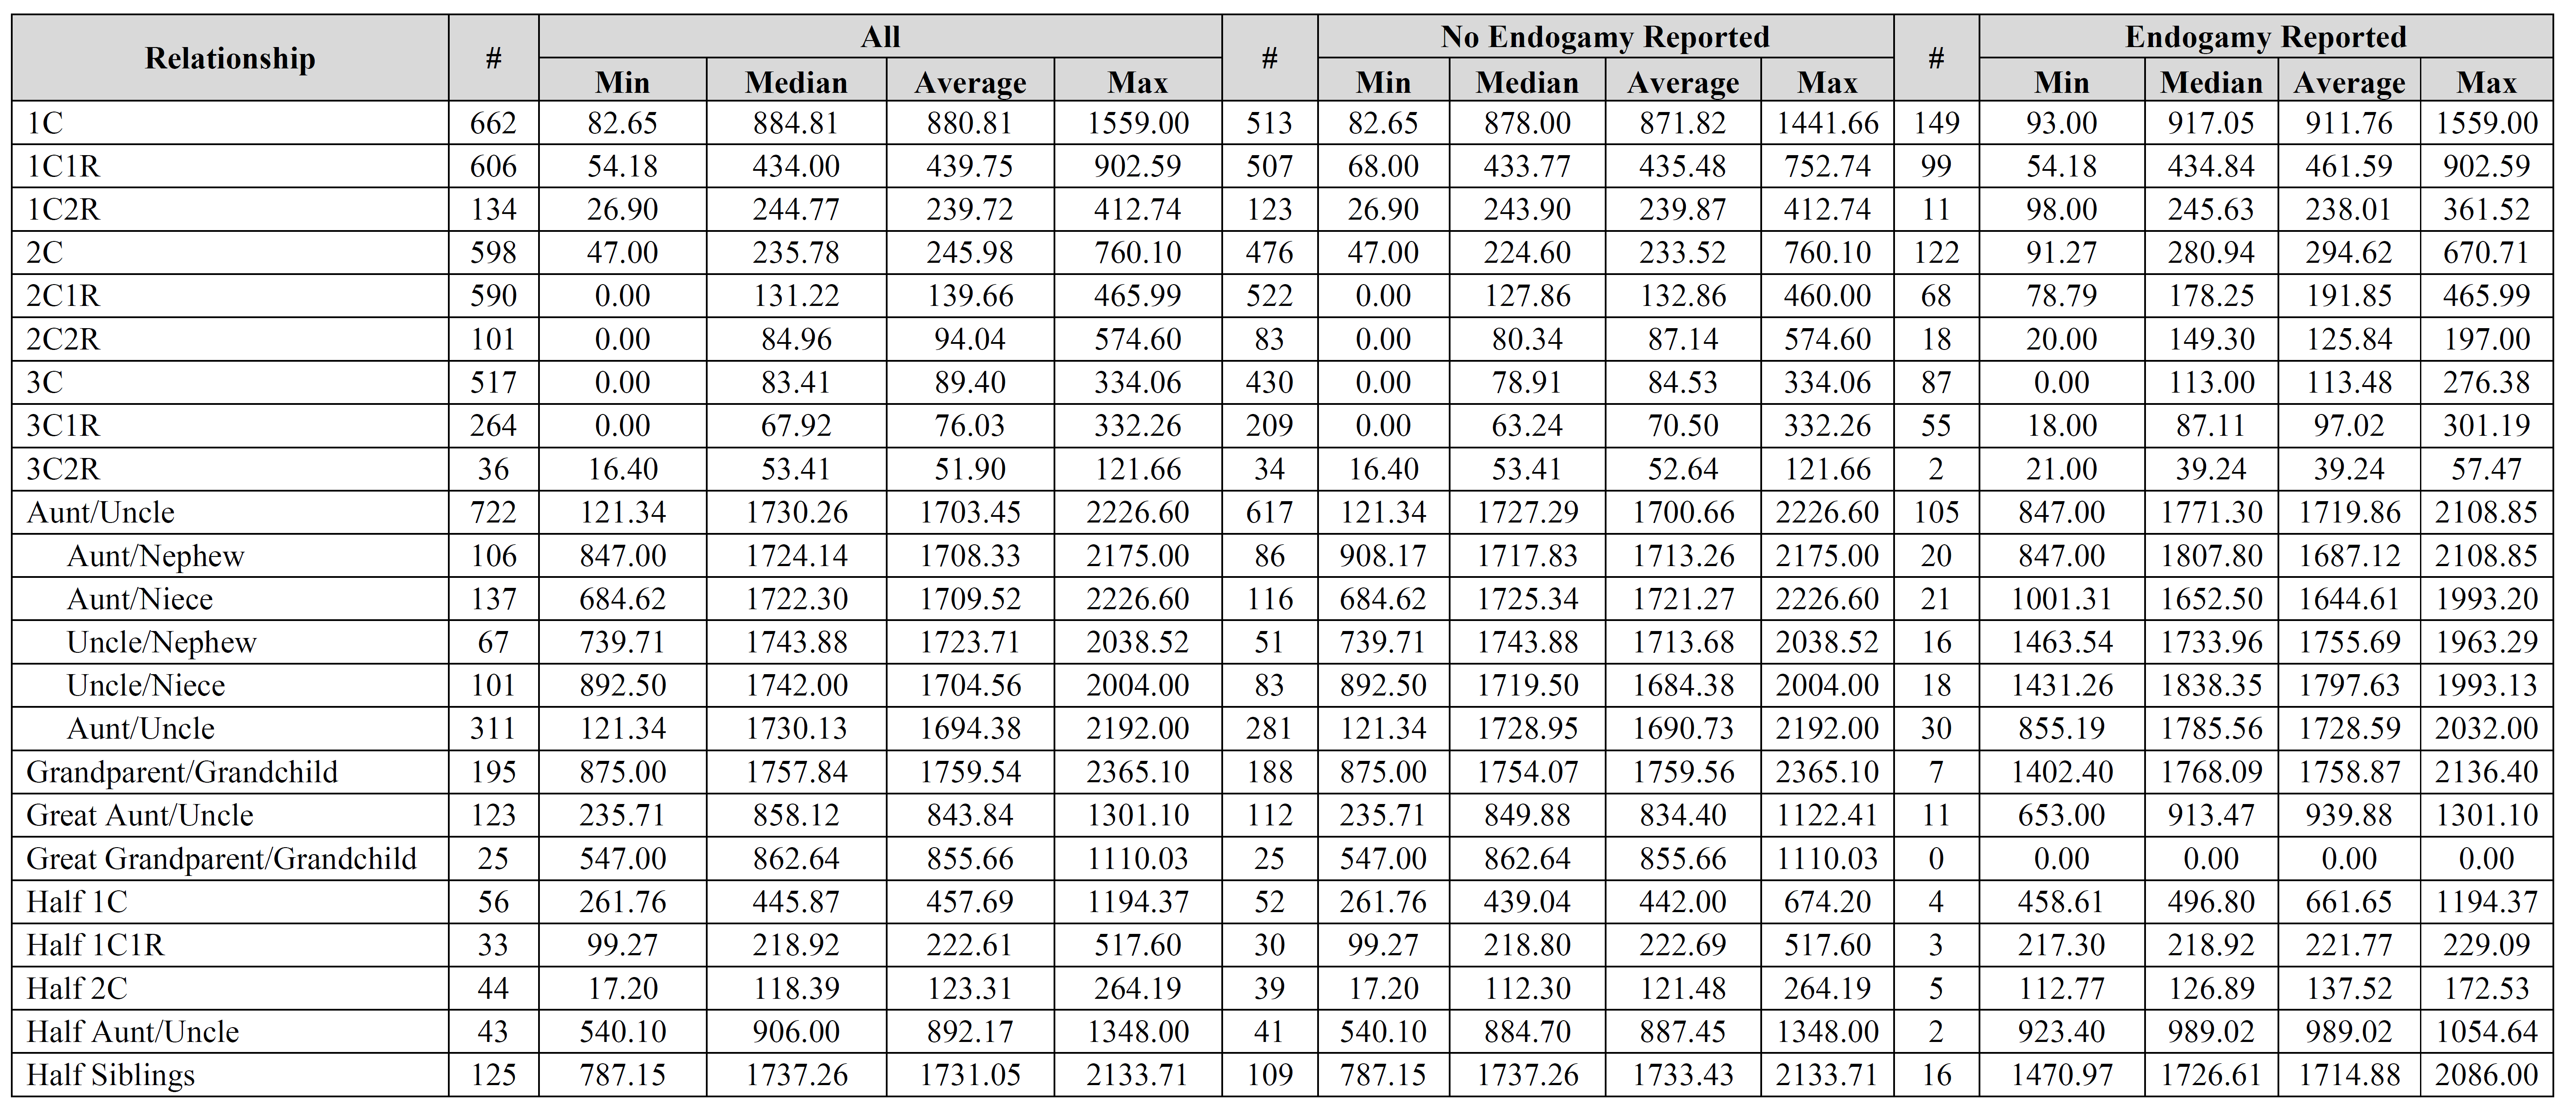
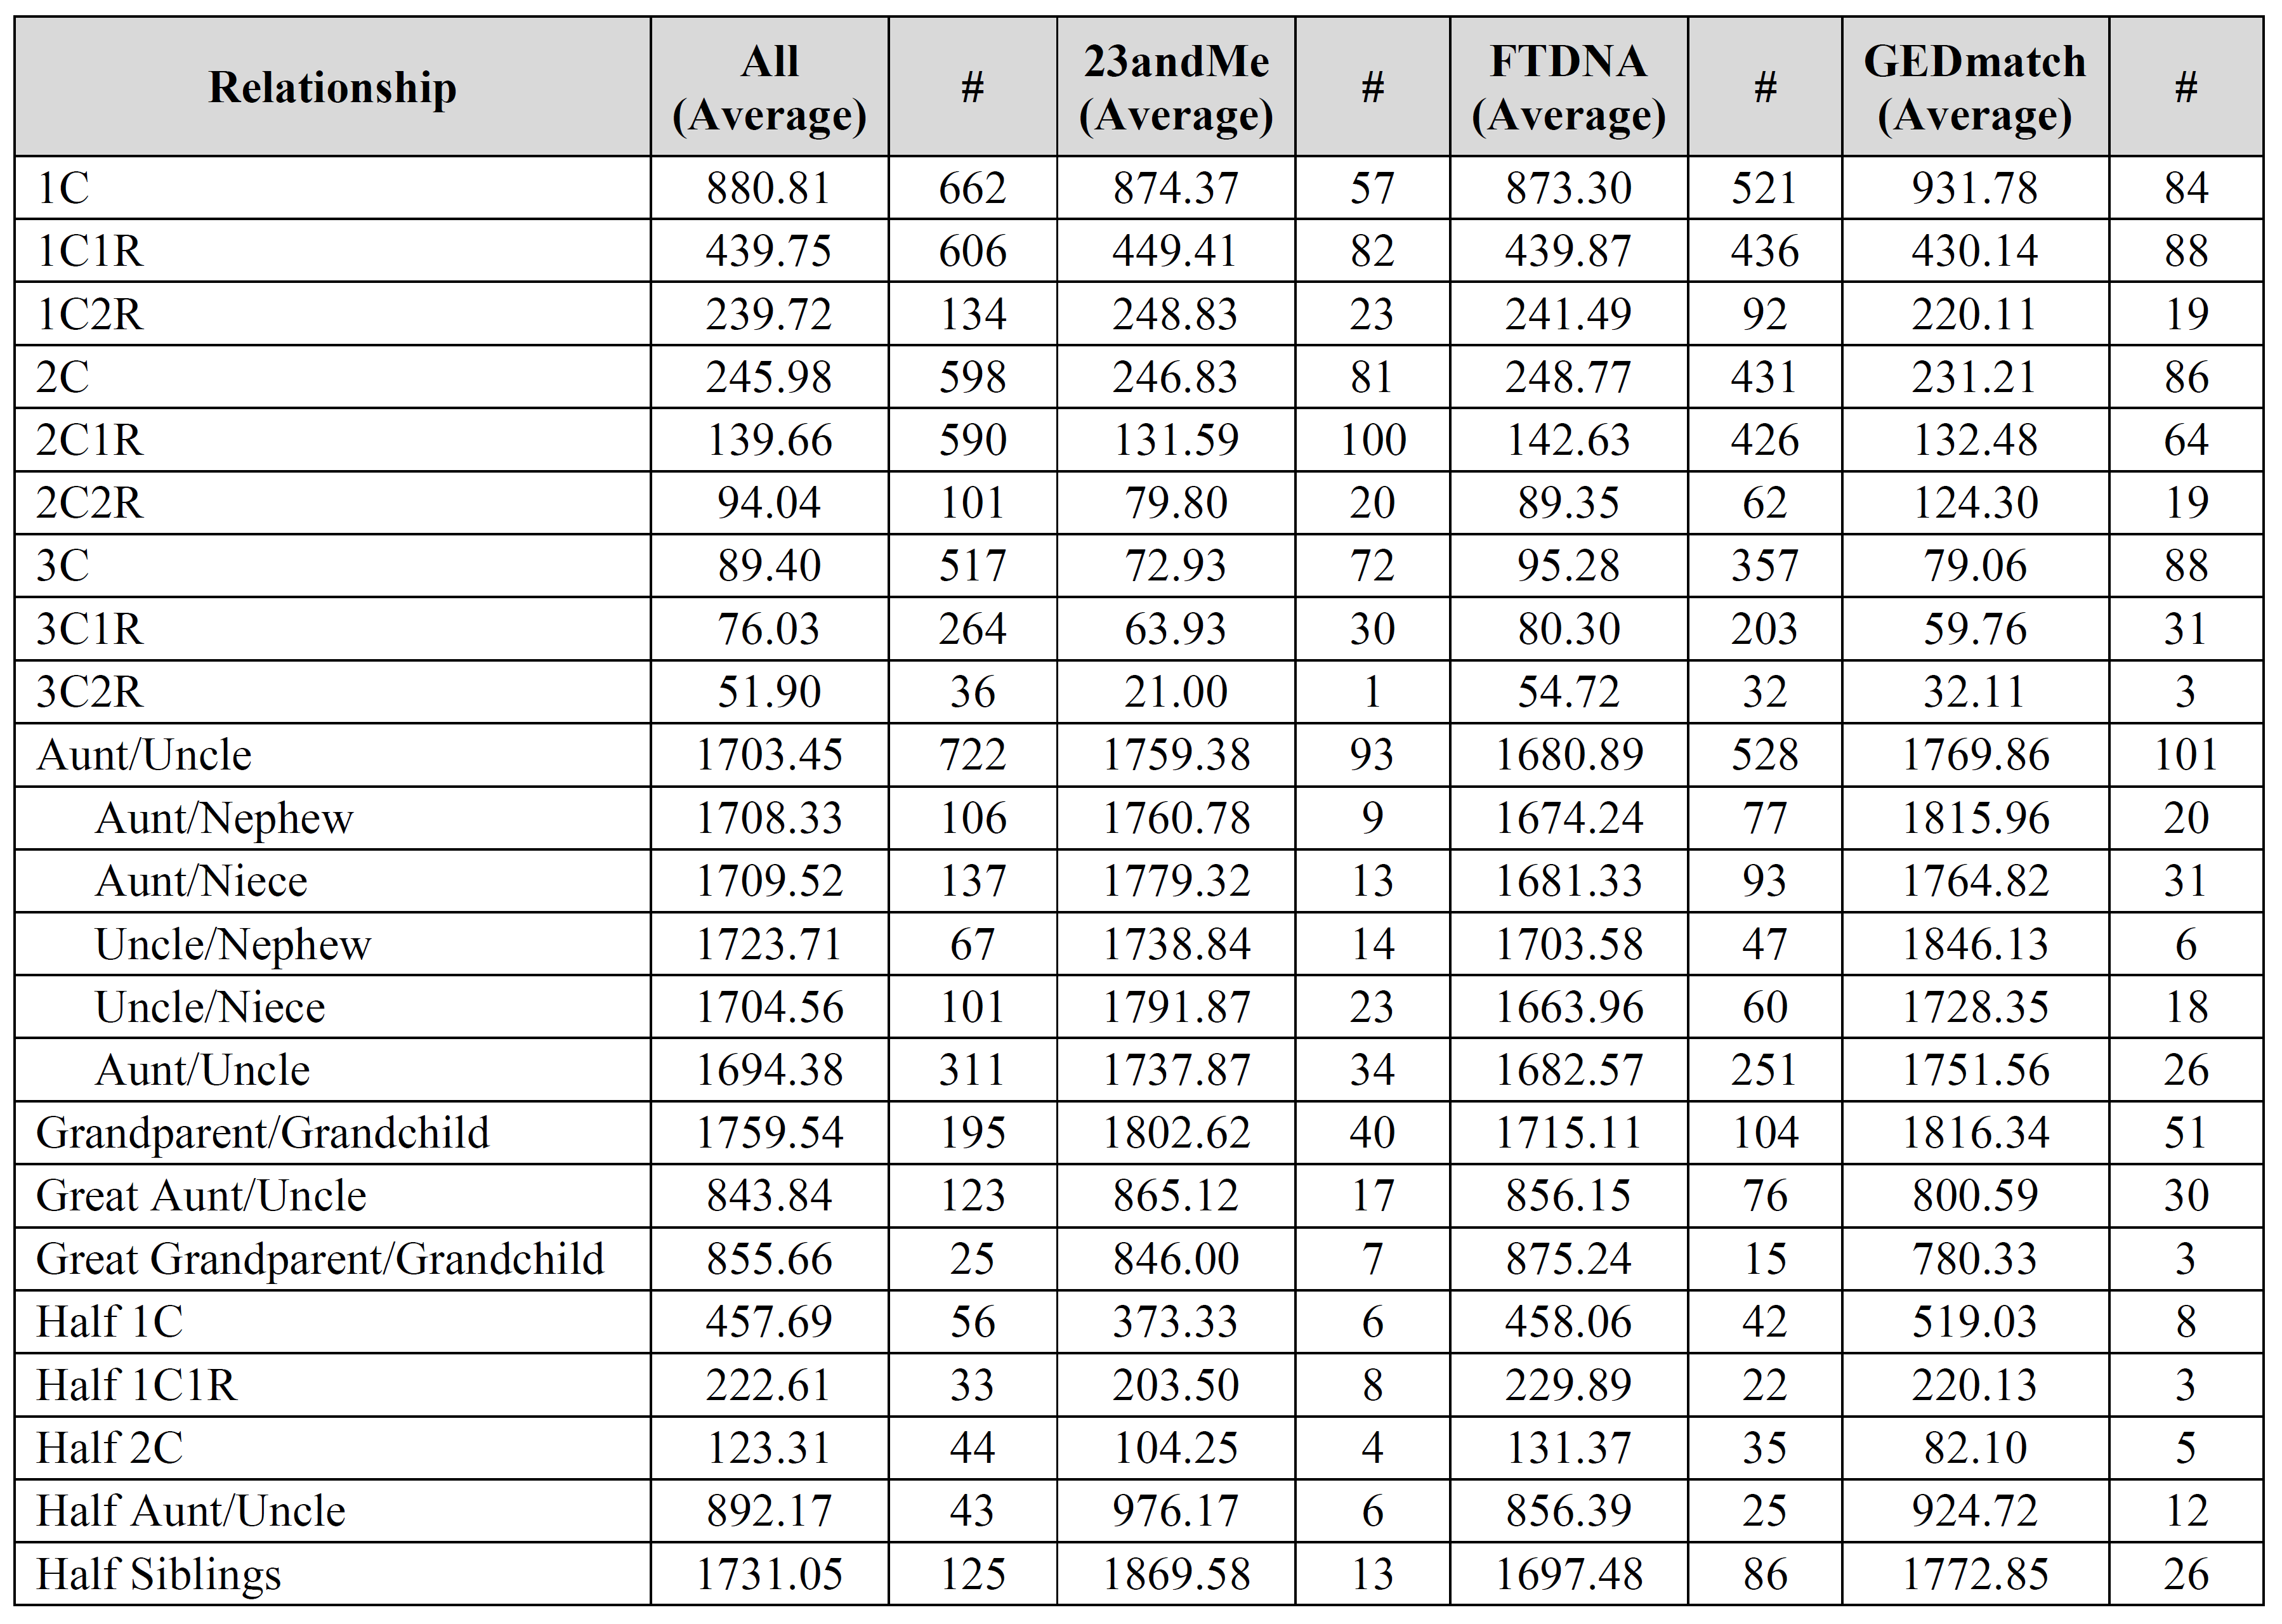
David – the fourth, fifth, and sixth images contain the breakdown per company (see the “#” column for each company). Is that what you were looking for?
Oops. Sure enough. My focus was stuck on the first. Sorry and thanks. That is perfect.
No problem, just glad I could actually provide (quickly and easily!) exactly what someone was looking for! Let me know how it works out for you.
This is very important work, because people need to know just what constitutes “relationship. But I am somewhat new to this, so could you explain to me what the numbers in these tables are. cM? or something else.
Thanks
The columns marked “#” are the number of user-submitted relationships utilized for the calculation. All other columns are in centiMorgans (cM).
Great data! Thanks Blaine.
I do have one suggestion. Using the excel data you provided for “All Reported Results” I replaced the relationships with the corresponding Coefficient of Relationship (r), re-sorted by r then put the results into a log-log plot with fitted straight lines for the four categories as suggested by the meiosis model. This shows very nice correlations for the Average and Median data R2= .97, a good correlation for the Max data R2=.91 and less correlation for the Min data R2=.66. The plot suggests to me that the Min data is harder to measure and may have been biased by the reporting rules used by the three vendors. I had removed the zero data prior to using the log-log plot. If all of the reported data were plotted this way it should be possible to calculate the mean and fit error bands to the data which would be more helpful than the reported Min and Max values. This could then be translated back into a table showing the usual relationships.
Perhaps we have some statisticians who can make further suggestions.
Would be glad to send a copy of the plot; just tell me where to send it.
Jim
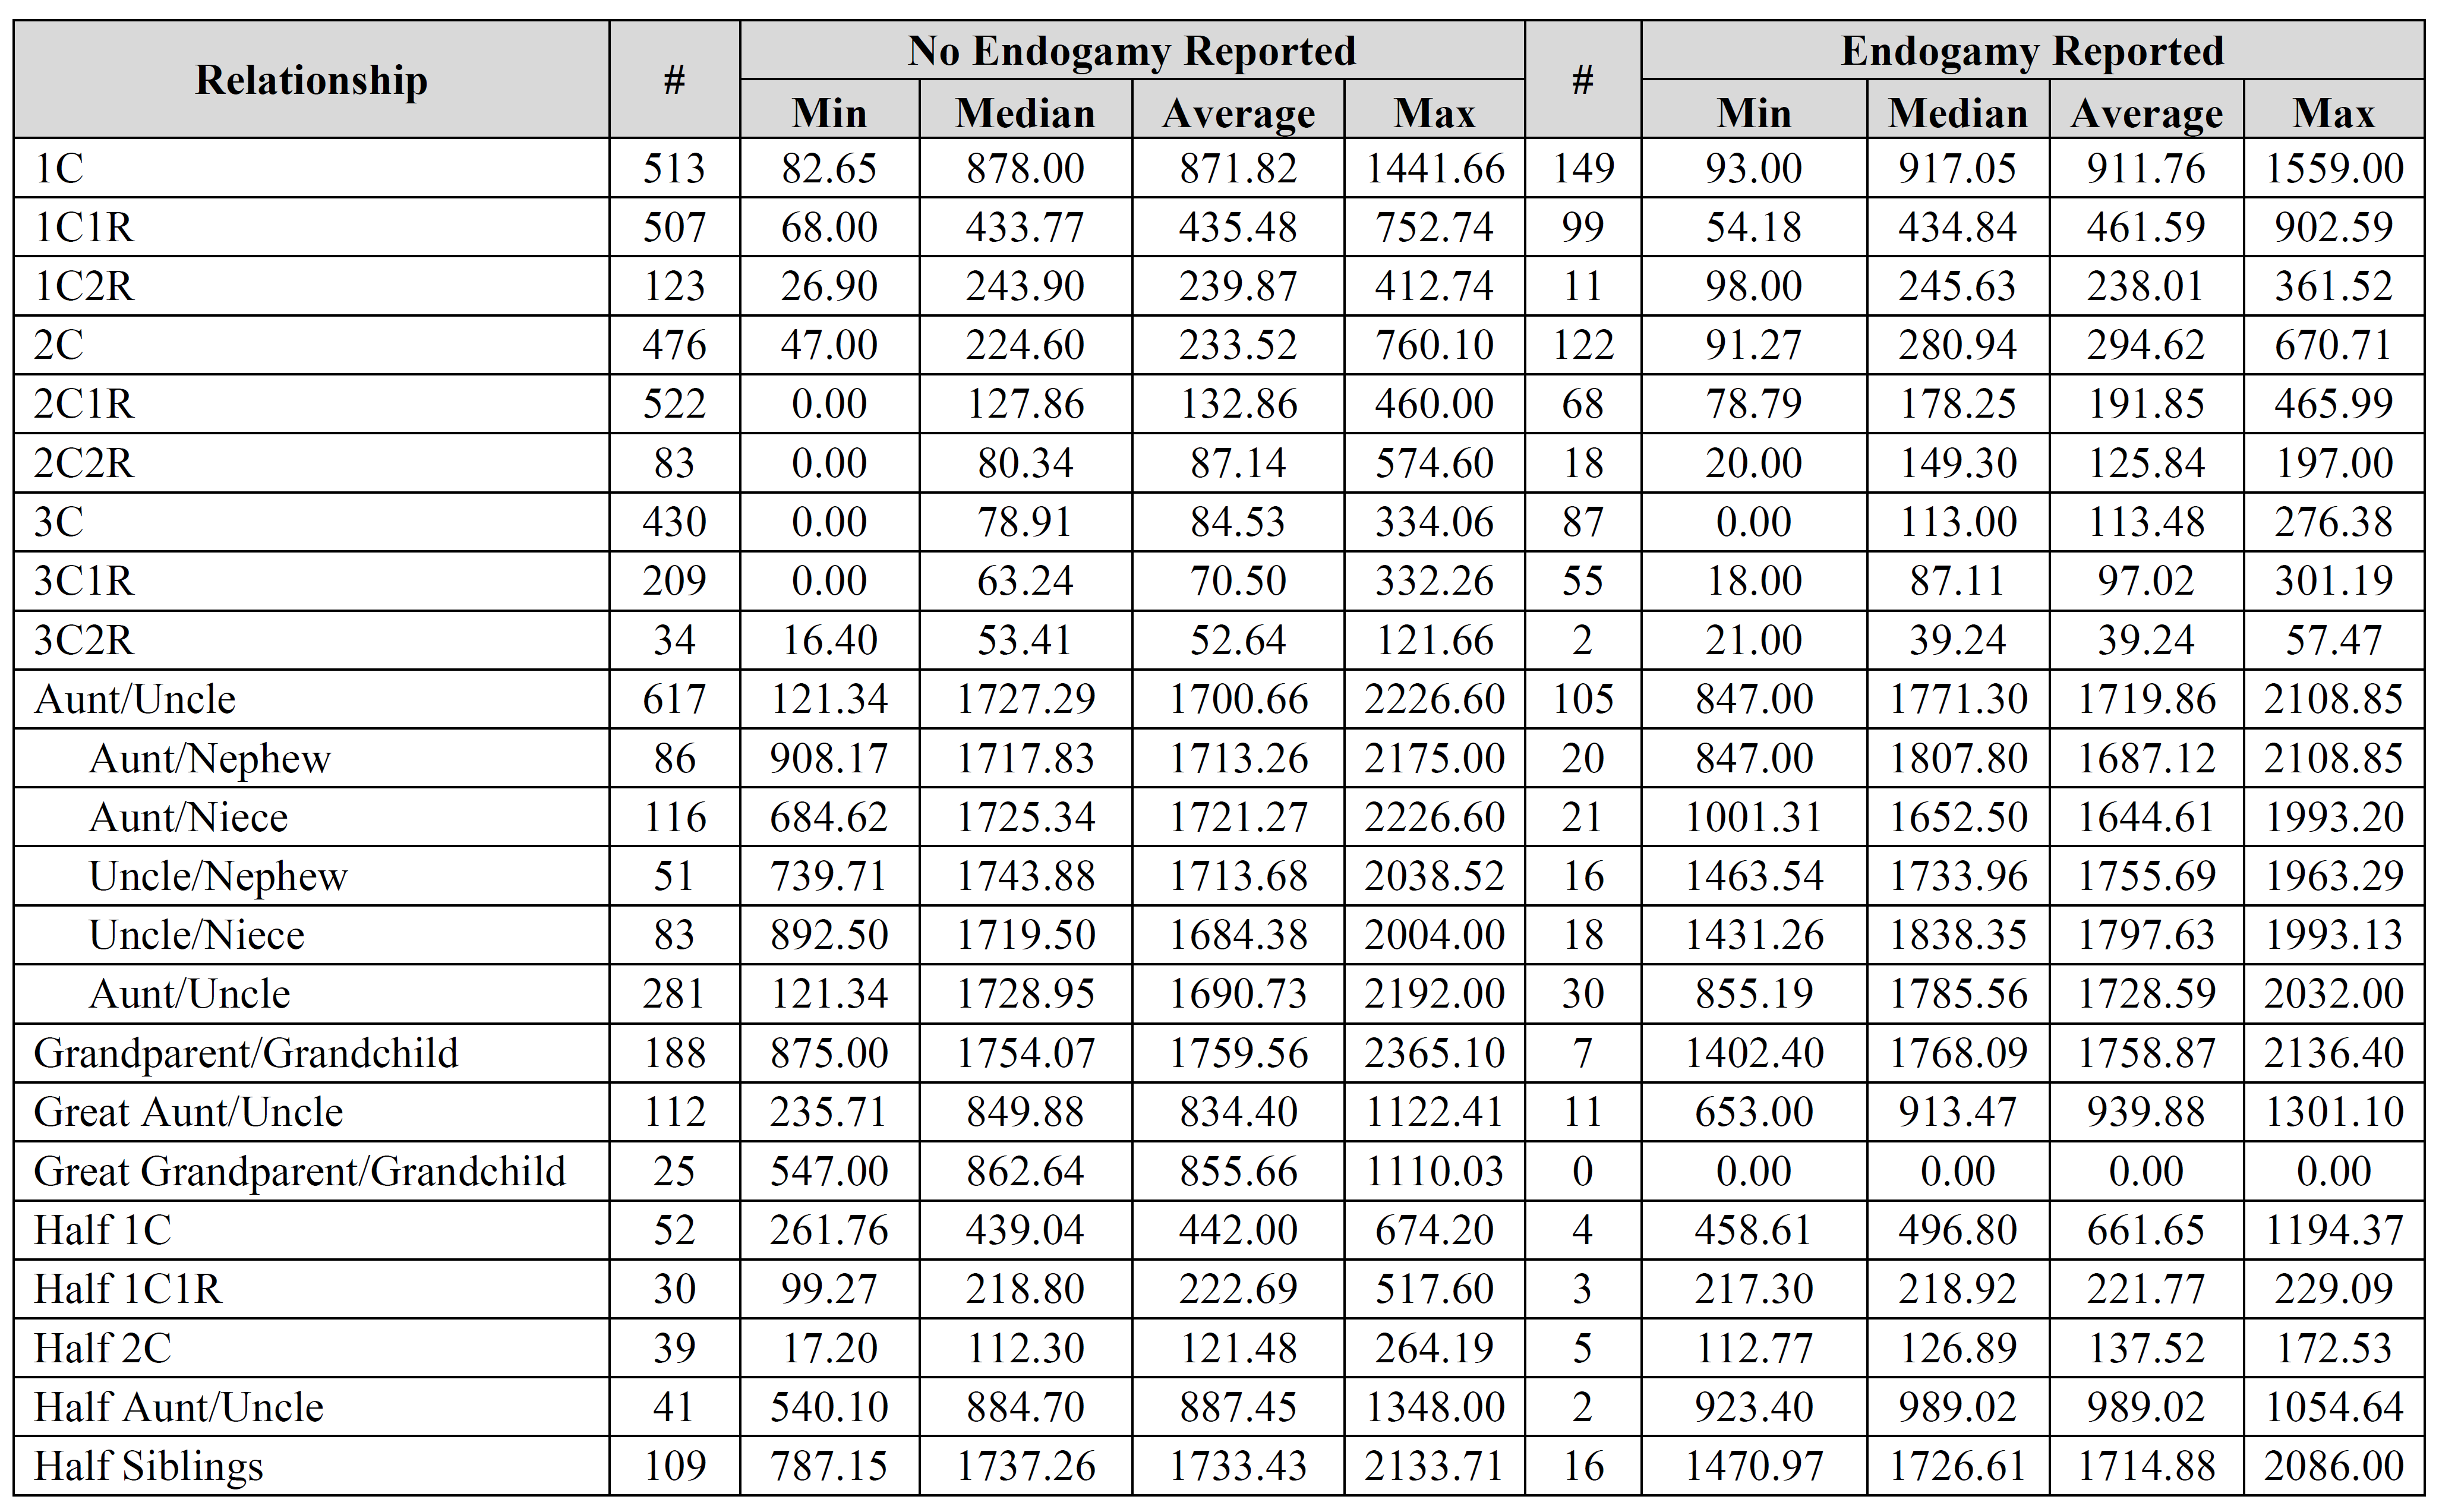
Jim – thank you for the suggestions, it is greatly appreciated. I’d be interested to see the results you came up with. How do you account for relationships with endogamy in your calculations? Did you compare results for “endogamy reported” to “no endogamy reported”, by any chance?
I disagree somewhat with your analysis of the min and max values (or at least I think I do). The compiled data is going to be used by genetic genealogists primarily for two purposes: (1) to determine whether the total shared cM for a known relationship fits within the compiled data (i.e., whether the reported amount is located between the min and max, and perhaps how close it is to the median and/or average); and (2) to estimate a possible relationship from the compiled data based on the amount of shared cM. The min and max are currently absolute values, not probabilities, and it is quite likely that these numbers will be utilized more than any of the probabilities. Using second cousins (2C) as an example, no one has ever reported more than 760 cM shared by second cousins (at least according to this data). As a result, if I share more than 760 cM with my second cousin, I’m going to have to explain that somehow; perhaps there is considerable endogamy or perhaps we actually have a closer relationship, among other possibilities. Similarly, no one has ever reported less than 47 cM shared by second cousins (at least according to this data). If I share less than that, I’m going to suspect that something is wrong.
If I’m not mistaken, you’re talking about the probability that results for second cousins could be a maximum of 760 cM or a minimum of 47 cM, correct?
In putting together data to contribute, I had my brother do a test with FTDNA. Much to our surprise, his Autosomal DNA test came back indicating we had aprox 1760 cM of common DNA.
Now I have to explain to him the term NPE…
Good piece of work, Blaine! Thanks. I wonder if those who are reporting zero or low cMs for known relations are NPEs and they don’t know it.
This happened to a person I thought was my first cousin. His results showed we were not a match. However when I had his brother tested, we had over 1000cMs in common. He then told me a family secret that unknown to his brother, he didn’t have the same father!
Are you still seeking/accepting data?
Yes, I am.
Blaine, Thank you so much for all your hard work in collecting and analysing this data. This will be a wonderful resource for our community. I’m intrigued by the differences in the reported cMs between 23andMe and FTDNA. FTDNA seem to consistently report fewer shared cMs than 23andMe for closer relationships and more cMs for more distant relationships. I presume this is somehow related to FTDNA’s inclusion of small pseudosegments in the total cM count though I find it odd that the closer relationships aren’t also affected by the same phenomenon.
Any value in looking at cM distribution curve for a least one of these relationships? Thank you.
I am a 53 year old female and share 1321 Cm with a 61 year old male. The results state first cousin. Is this true or can it be another relationship category? I am searching for my unknown father and I thought this could possibly be my uncle?
1st Cousin, Uncle, Nephew or half-sibling would be in range for that shared amount.
Love the graphic bar chart (final, Project-21) the best. Would love it annotated further with a vertical bar in the middle to represent the expected and the actual average. Also, would be more descriptive with solid box out to standard deviation and then only straight line with end cap vertical line to the min/max outliers. Gives a better sense of how tight the values may be around the center versus the min/max outliers which may be to far to be believable, in some instances. Could develop what I mean if you provided the additional data.
Let me mention first again. Great job and thanks for doing this. What I am looking for in my own stage of knowledge search. But Arrgh. Just discovered an “ugly truth” of both GEDMatch and even 23andMe regarding total segment match length (a key value you have been collecting). The value is different depending on where you look. It appears GEDMatch uses the common 7/700 as an AND threshold condition to report someone as a match. But then blindly goes ahead and adds up all the segment lengths, including segments less than 7cM long, to create the Total cM value in the one-to-many chart. Not clear if they are simply using an OR condition to create the Total CM or maybe defining a new min matching point (say 500 SNPs) to decide what to add into the length. Key is, the one-to-one comparison and result is using 7/700 as the AND condition and gives a different, lower Total CM length. This does not make much difference for very close relations but makes a huge difference for more distant ones. Discovered this when trying to prepare about 20 submissions for your exercise while disambiguating someone who kept claiming “you are my closest match” when I appeared way down the list on both 23andMe and GEDMatch. The Total CM is 32cM but longest is 7.9 in the one-to-many table. But in the one-to-one, there is only a single 7.9 cM segment and total length. Only if I do 1:1 with the 5/500 values do I replicate the Total CM given in the 1:Many table. 23andMe has a similar nuance although not as noticeable. I do now appreciate both of their reasons for a default sort using their calculated generational distance. It better takes into account the segment length over Total cM’s for lower matching individuals 🙂 Key is, which value are you trying to collect? And do you know which you did collect? Arggh!
I’d love to see the distribution of 1st cousin values in histogram form. Your lowest cM value is 83 but I’d like to see the shape of the tail from about 400 down….
If you can supply the data I can make the histogram…..
Thanks!
I would also be greatly interested in something like like a standard deviation or distribution curve for the results. Especially for second cousins or more distant. Thanks for this analysis!
Have you done siblings yet? We have a situation in my family where, according to AncestryDNA, supposed full siblings only share 1492 cM.
Have you considered plotting distributions of your collected data. It would be interesting to see how close these sample distributions look like compared to the distributions proposed at http://segmentology.org/2015/11/07/segment-size-vs-cousinship-chart-needed/
It would be very interesting to calculate the variance and standard deviation of your sample data as well. The standard deviation of each distribution is an excellent measure of the “spread” of the distributions.
Sample variance is a pretty simple calculation. See http://www.math.uah.edu/stat/sample/Variance.html and http://www.statisticshowto.com/how-to-find-the-sample-variance-and-standard-deviation-in-statistics/
Thanks so much for this. It has been a HUGE help!
Now that Ancestry has added cM’s to their info, would you be adding that to yours too in the future?
Is it possible to get access to the original data? There have been several requests for standard deviation and distribution curves, which are vital in assessing statistics like this. If you don’t have the time to run the numbers, I’d like to do it myself if you don’t mind.
Thanks in advance.
Your analysis does not appear to include data from AncestryDNA. Do you know of any differences in their procedures or reporting that would cause you to expect their results to diverge from the ranges, medians and averages your data set produced? Or do you think is it reasonable to expect their results to roughly parallel your findings?
At the time these charts were constructed, AncestryDNA was not providing total shared cM data. However, since that time I have collected 1,000’s of data points for AncestryDNA, so the update that I am currently working on will include that information.
Thank you for the quick reply. I have not seen any independent review of the reliability of AncestryDNA data and analysis when it comes to matching. There is the technical factor with regard to testing quality control and accuracy in producing reliable raw data. Then there is the soundness of their analytical standards for reporting matches, and what confidence one can have in those results. Most of the reviews I see relate to their ethnicity estimates and genealogical tools. But sometimes a previously unknown very close match can have profound family implications, if you catch my drift. So it can be critically important to know whether results AncestryDNA reports with “extremely high confidence” can fairly be considered definitive, or more of a screening level tool that should not really be relied upon. The cM data they provide, if accurate and fairly comparable to the data on your chart, certainly provides a basis for understanding their confidence rating. But I would be very interested to get your impression on this reliability question.
Blaine
I am working with several adoptee situations— the one involves tests from half siblings– same father different mother’s back in he 1890s- 1905… Both wives had one son and one daughter. Triangulation has been Between with:
1) 92 yr granddaugther of w1 an X segment 60.5 cms (t=180.5 cms atDNA inclusive of xDNA) FTDNA match
2) son-grandaughter-ggson of w2 with 150cMs no xDNA
3) son-grandaughter-ggson-gggdau of w2( dau of 2) adopted 1967 120cMs
4) dau-grandson-gggd of w2 adopted 1951
The way I see it – xDNA does not descend with regular recombination mechanisms of other atDNA….the shared segments seem to place almost exactly between “normal” relationship degrees. Other charts put in half sibling for one or two generations… there are lots if adoptees out there searching with half sibling relationships- perhaps you might think of breaking something out for these scenario. If you need separate data submission let me knw- while I am active working on these and I can cross post.
Thanks a million for his work
It it possible to have a half sibling and only share 1080 cm per Ancestry.com. It is listing as a first cousin but after talking to everyone involved , it looks more like a half sib.
What is the lowest number of CM half siblings share
A man named John was born in 1601. His descendants married among themselves at least four times in eight generations. Pedigree Collapse. The most recent marriage of cousin was in 1880.
I found a cousin that descended from this 1880 marriage. The amount of DNA we share is close to first cousin or sibling—but we are actually 3rd cousins.
I suspect that an overabundance of DNA has skewed the results.
John has contributed to the DNA over 7 times, through his descendants, which causes John’s DNA to be plentiful, even after 380 years.
I really like the Shared cM Projet chart as it provides an excellent summary of the results. I did find one thing missing so I modified a copy for my personal use by inserting the average percentage in each of the boxes. Now when I refer to the chart I can see instantly the cM figures and the nominal percentages. This helps when DNA results are listed in percentages. I was going to forward a copy of my handwork but don’t see how to do it here.
Blaine, prior to.my father’s death, he needed a blood transfusion and since I was healthy, I was the likely candidate . However, how blood type and my mother’s were identical, but mike was different. Both have passed and both denied any problems with my birth.
Recently, both me and my niece submitted dna to ancestry and we.match at 1347cM at 52 .
Can she be my full niece since the average for a share with a niece is 1700 cM? We have found that my mother and father had large families and.that there was a g g aunt that married from my dad’s side into my mom’s.
I would really appreciate your help.
Kindest regards
OK, so…according to cMs, my first cousin shares enough DNA to be a half sister (1910 cMs; 57 segments). Our fathers were brothers, fraternal twins…they looked like brothers, but not identical, you could tell them apart. I guess one explanation is genetically they really were identical? Or…you get my drift. Any other reason we would share this much DNA as first cousins? This is also not a double cousin situation. Any thoughts would be appreciated!!!
Have been on Ancestry for over a year. Have been looking for my mothers parents…she was adopted. I found her mother but the father is still a bit of a mystery. Yesterday had a DNA match show up that would be on moms fathers side. The match showed us at 811cm and 37 segments. My mother and this match to me may share the same father. Ancestry says we are possible 1st cousin while others…DNA devices says it is possible that she is a half aunt. I’m not good at this and this has me very confused. I am 67 and she is 75 years old. Can you help…please. Thank you
I have a new match at FTDNA. 227 cMs total, 47 longest. She is my one-half 2Cousin, 1x Removed. That seems to be an outlier. We found one tree match but I would have to build her a tree to find other matches which I think would account for the high cMs.