Last week I published “Small Matching Segments – Friend or Foe?” to join in the community’s conversation about the use of “small” segments of DNA, referring to segments 5 cM and smaller (although keep in mind that the term “small,” without a more specific definition, will mean different things to different people).
The question that the community has been struggling with is whether small segments of DNA can be used as genealogical evidence, and if so, how they can be used.
As I wrote in my post, a significant percentage of small segments are false positives, with the number at least 33% and likely much higher. In my examination and in the Durand paper I discuss, a false positive is defined as a small segment that is not shared between a child and at least one of the parents.
However, as CeCe Moore point out in her post “The Folly of Using Small Segments as Proof in Genealogical Research, Part One,” this is an artificial and misleading definition, as even “real” segments (those shared by a child and at least one of the parents) are often false positives because they are not found in three consecutive generations. The percentage of these “real” segments being found as false positives is unclear, but CeCe’s post makes it clear that it is unexpectedly high.
To continue the conversation, I’ve performed some additional analysis using data from myself and my parents. In this post I’ll address a couple of hypotheses the community has discussed over the past week as ways to possibly use small segments in a genealogically meaningful manner.
- Hypothesis #1 – A Small Segment with More SNPs is More Likely to be IBD
It has been hypothesized that the more SNPs a small segment has, the more likely the SNP is to be a real, IBD segment. This seems like a very logical and reasonable hypothesis, and I’m not immediately aware of any study that examines the question (if you know of one, please let me know in the comments!). So, to date, positions on one side or the other have been anecdotal.
To examine this hypothesis, I identified all small segments between 4 and 5 cM that I shared with my genetic matches at Family Tree DNA. For each segment, I determined whether it was “real” (shared with a parent) or “false” (not shared with a parent). Now as we’ve learned from CeCe Moore’s recent post (see “The Folly of Using Small Segments as Proof in Genealogical Research, Part One”), a significant percentage of these “real” segments shared by a child and parent are not shared with a grandparent, meaning that they are actually “false” segments. So even many of the “real” segments identified in these experiments are not IBD segments.
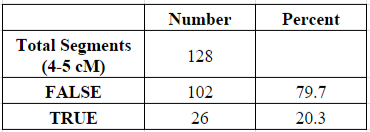
Of my 6,514 shared segments of 1 cM or larger, a total of 128 of these segments (1.96%) were equal to or larger than 4 cM and less than 5 cM. Of those 128 segments, about 20% were determined to be “real” (shared with my parent) and 80% were “false” (not shared with my parent):
Family Tree DNA also gives an approximate number of matching SNPs each segment. Matching segments of the same centiMorgan distance will have a variable number of SNPs depending on a variety of factors. To examine a possible relationship between the number of SNPs and the “real” versus “false” nature of a segment, I compared the number of SNPs for each of the two types of segments.
For my 102 “false” segments between 4 and 5 cM, the average number of tested SNPs was 833, while the average number of tested SNPs for my 26 “true” segments was 903 SNPs. Although this may at first appear to be an important distinction, based on the data I am still unable to point to a small segment and determine based on the test SNP whether the segment is likely to be real or false. The ranges of SNPs tested in the two types of segments was largely the same, as shown by the max and min.
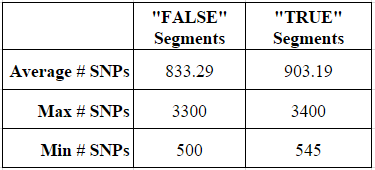
Thus, based on this experiment, I know that I cannot determine the “real” versus “false” status of a small 4-5 cM segment of DNA based on the number of SNPs. Indeed, based on my data, I cannot even safely say that a 4-5 cM segment with as many as 3,300 SNPs (more than 3x the average) is more likely to be real.
- Hypothesis #2 – Small Segments Shared with Closer Relatives are More Likely to be Real
It has also been hypothesized that a small segment shared with a close or confirmed relative is more likely to be real than a small segment shared with a distant relative. In other words, if I share a large, confirmed segment with a cousin, then it is hypothesized that the small segments I share with that cousin are more likely to be real. Again, I’m not immediately aware of any study that has examined this question directly (again, if you know of one, please let me know in the comments!)
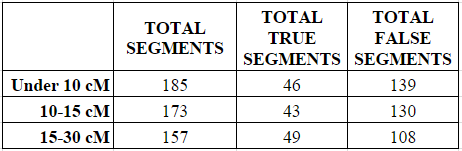
To examine this hypothesis, I took the first 25 genetic matches that: (1) were shared in common with me and one of my parents; and (2) shared a longest segment of either under 10 cMs, 10-15 cMs, or 15 to 30 cMs. At just the first 25 genetic matches it isn’t a very complete dataset, but it is at least a peek at what the numbers will look like. Indeed, finding the first 25 matches within the 15-30 cM category took me through the first third of my matching segment list.
In each of the three categories (under 10 cMs, 10-15 cMs, and 15 to 30 cMs) I counted all the small segments under 5 cM, and determined whether they were “real” or “true” (shared with the parent) or “false” (not shared with the parent).
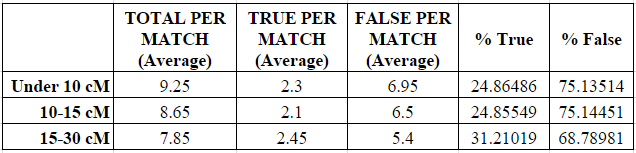
As shown in the next two charts, the number of small segments per match decreased in each category from a high of 9.25 average small segments in the under 10 cM category to a low of 7.85 average small segments in the 15-30 cM category.
Similarly, the average number of “real” (called “true”) small segments per match increased (and the number of “false” small segments decreased) slightly in each category, although the percentages were largely the same between the under 10 cM category and the 10-15 cM category. The percentage of “true” small segments increased noticeably from about 25% when the largest shared segment was 15 cM or less, to about 31% when the largest shared segment was 15-30 cM. So there does appear to be some relationship between the closeness of the relationship and the increased likelihood of a small segment being “real” (“true”), but it is extremely tenuous and should not be relied upon as reasoning. Indeed, the increase seen below was only 6%.
Based on this data, I am completely unable to predict the “real” or “false” nature of a small segment under 5 cM based on how closely related I am to the genetic match.
Based on the above I predict that the percentage of “real” or “true” segments will increase as closer relatives are used (above 30 cM), but I also predict that it will never increase to a number that allows me to safely identify a small segment as “real” or “false” based on the degree of the relationship with the genetic match.
I am fully aware that these are not perfect analyses, but they’re a beginning. They bring further awareness to the issues associated with small segments, and provide readers with some additional ways to analyze small segments.
- A Great Point from a Commentator
I received an excellent comment (HERE) from Ann Turner, M.D., co-author of “Trace Your Roots With DNA,” on my post “Small Matching Segments – Friend or Foe?” last week. In the comment, she wisely noted that – counterintuitively – the number of segments shared with relatives remains largely unchanged regardless of the distance of the relationship.
…For me, the average number of segments in the different relationship bins doesn’t change much at all:
3rd to 5th: 11.9 segments
4th to distant: 11.5 segments
5th to distant: 11.4 segmentsTo me, that’s an indication that it’s too easy to construct short segments just by coincidence….
It’s well worth reading the full comment (HERE).
Conclusions
So once again, the data I’ve seen leads me to conclude that the genetic genealogist’s ability to decipher between a “real” small segment and a “false” small segment is extremely limited. Ultimately I think it will be possible to identify segments that are probably real, but currently it is nearly impossible to use them in a meaningful way to support a genealogical hypothesis.
.
The conclusions that your conclusion leads to are the following:
No hard and fast rules.
Use your best judgement on your own work.
Keep your judgement out of other peoples’ work
Listen to and learn from the experienbce of others and apply judiciously.
Read the work of the best people in the field, but do not become part of a herd.
Support research – do it yourself if you know how.
Israel – thank you for reading and for these excellent conclusions! I agree almost completely with your conclusions. I would just assert that it is our responsibility – especially at this early stage of genetic genealogy – to review and critique the work of others (if they put it out into the world). I think that helps make everyone’s work better and improves the field.
I concur that it is the responsibility of those who have knowledge in these areas to critique what others have written. Otherwise the entire community is swept up into a sea of confusion, which might benefit some (enterprising entrepreneurs) but on the whole hurt most efforts at solid family history.
Genealogy has been around for a long time, and has so often seen charlatans come in and proffer some easy but erroneous answer – notably the existence of family trees that ties one back to some great historical person.
One thing I would like to see is that you reduce the use of the words “real” and “true”, because they have so many meanings to different people. “False positive”, “false negative”, “genealogically misleading”, “population wide” and so forth as phrases may be more awkward to type and read, but in the end will bring about more clarity. (Let’s hope!)
Thanks for reading and taking the time to comment. Genealogy has been revolutionized in the past few decades do to community efforts to achieve a standard, and I hope the genetic genealogy community continues to attempt the same thing.
Regarding the “real” and “true,” I agree that they can be misleading. I approached this experiment in Excel as a mathematical problem, so for me the segments were either TRUE or FALSE. I will try to keep your comments in mind in future posts, thank you.
Israel—No truer words have been spoken in a very long time in the Genetic Genealogy community. I hope you post them on the ISOGG list. With your permission I would like to post them in my Beginner’s Guide with attribution. I very much appreciate Blaine and Ann and others work. I will point out something that I find distressing. A 20% real rate or even a 10% one is a very significant amount of real positives. So I do think being dismissive of small segments is as unscientific as claiming they are proof. They are simply a clue, a piece of evidence that must be weighed against other pieces and probably only worth doing if you have a good reason to do so and plenty of time and energy that arguably may be spent better elsewhere. I’ll take one anecdotal way I use small segments. I have two first cousins that are 1/2 Scandinavian and one 1/2 colonial. I am much more broadly mixed but share 1/4 Scandinavian with them. I have dutifully recorded our matching segments on our spread sheet even little ones. When we match a Swedish or Norwegian person I know where that comes from even a small segment. It did not come from my Scottish or German ancestor. I get pile-ups in these small segments and there may be a range of segment lengths with some way above 10 cM. I consider these indication of shared Norwegian or Swedish ancestry and that may be quite a ways back. I use it as a clue or another piece of possibly helpful information. In other areas particularly in the parts of my tree with some endogamy it is far less helpful from a genealogical standpoint yet I sometimes hold on to some small 4-5 cM segments from KY ancestors as they “seem” to indicate again a shared geographic ancestry—-since some of these segments are shared by people not recently related it suggests more of say a “Scots Irish” pattern—it tells me nothing I’d bet the store on—but it is a clue. Just like when I do genealogical research I collect many clues—and end up discarding many if not the majority of them. I guess I am just a contrarian that believes that any baby thrown out with the bathwater is an unnecessary evil. Uncertainty is a variable that always exists in scientific inquiry. Modeling without uncertainty can lead to false assumptions too. If there is one thing we need is a fundamental understanding of statistics and analysis. Combine that with Murphy’s law and you get “whatever can happen, will happen and you can count on it not to happen when you expect it to.” I read everything I can but a scientific hypothesis and conclusion is just that until another better one comes along. I remember the first time I read that YSTRS are just junk DNA and I thought that does not make any sense. Well I knew nothing at that point on which to base my conclusion but as it turns out they weren’t just junk. At a time in the future when we can look at Full Genome Sequencing and have ways to filter large amounts of data effectively we will probably see what we are seeing now—that the smaller the segment the more likelihood it is IBS but there are likely to be no absolutes and always a certain level of uncertainty. Anyone who demands rigid categorization and perfection is in the wrong hobby.
Well, there goes the most frequently used logic for including all manner of assorted small, even tiny, segments. Hopefully it makes the intended impression.
The question of SNP density is a good one, we do use very low SNP density as an indicator of IBS largely based on the fact that the less SNP’s the less diversity/more uniformity largely based on the statistical fact that the less SNP’s, the less mutation/ variation, the more stability, making these segments essentially useless in practice regardless of what we call them (and there are conserved segments, also characterized by low variability/density). But, I’ve scoured the literature for years and have not found any direct statement to the effect that the reverse, that high density segments carry a higher likelihood of being IBD may be or is the case. Statistically, however, where there are more SNP’s there is, in theory, more variability. And, it’s that potential for variability that we need.
Laura – thank you for reading and commenting! I hope more people and researchers examine this question of SNP density. Well, actually I hope we switch to full genomes and skip the question entirely, but I think that’s a few years away!
Re the SNP density question, I predict that the Human Leukocyte Antigen region (white blood cell types) on chromosome 6 is responsible for those numbers in the 3000 range. I have some more background on the HLA in my JoGG column “Up Hill and Down Dale in the Genomic Landscape”
http://www.jogg.info/62/files/SatiableCuriosity.pdf
It would be interesting to know if this constitutes a pileup region at Ancestry. This would vary from person to person, depending on whether you have one of the common vs rare haplotypes.
Yes, sure enough, they were both on chromosome 6! I’d love to know if this is a pile-up region as well.
I was going to include graphs of the SNP concentrations, but thought they would be overkill. Maybe I’ll add them when I get an opportunity.
Thankyou so much for your groundbreaking paper. I feel like all of us now are just tasting what it can be like. I think your findings will be added to the rest of the data and we can get better analysis for all of us! Hungry for more people to test.
Blaine, Thanks for publishing this analysis. Most of us do not have a 3-generation set of data to make this analysis. I’ve used a lot of shared segments in my chromosome mapping (now at 78% with Common Ancestors (not all locked in of course), and 94.5% of the structure locked in). I used a 7cM threshold for 3 years and have been using shared segments down to 5 cM for the past 2 years. I estimate at least 90% of the 5-7cM segments do not Triangulate (and I classify them as IBC, and remove them from the main spreadsheet). Many of these 5-7cM shared segments are impossible to determine if they Triangulate or not. I am concluding that these 5-7cM shared segments are not worth the time/effort to put in my spreadsheet and/or analyze. Larger segments are pouring in faster than I can keep up with them. For Triangulation and Chromosome Mapping, I would not even attempt to use shared segments under 5cM. Someday…. when the chromosome map is largely finished and Common Ancestors are walked back 8-12 generations in each Triangulated Group… THEN I think I will go back and see if some smaller segments “fit”. Heeding Israel’s sage words, this is what I will do – to each his/her own.
I am studying if it might be possible to establish a common ancestor at the level of 8th cousins. I have as the matching target a verified descendant of the desired common ancestor. I am using three other documented relatives to me on the same family branch (one fortunately a 6th cousin 2x removed). Thus far, we have all matched using GEDMatch at 5 cM 100-300 SNP levels on a certain segment on Chr 15. Of course, these may be false positives. My goal is to recruit a larger number of cousins to me on this family branch, and see how they match. I hypothesize that if many more relatives than random ones match this segment than the probability becomes more convincing. For instance if ratio of matches by relatives/matches by non-relatives >>1, the probability of common ancestor =>100%.